On Bassoe Analytics, you’ll find a wide range of commercial data, technical data, valuation data (from our Rig Valuation Tool), and graphing tools.
Bassoe Analytics contains continuously updated information including:
Bassoe Analytics is an open source and collaborative offshore rig database and analysis platform. Here's what you can do with it.
On Bassoe Analytics, you’ll find a wide range of commercial data, technical data, valuation data (from our Rig Valuation Tool), and graphing tools.
Bassoe Analytics contains continuously updated information including:
Bassoe Analytics’ collaborative features make it unique. While all users can contribute data, Bassoe Analytics, along with Bassoe Offshore’s brokerage team, manages the core data. Updates made to the data are not activated until the data updates are verified and approved by us. The fact that we encourage real-world industry engagement, but also monitor it, ensures that data is always updated and consistent.
Yes and no. We want to create more transparency and provide better insight in the offshore rig market by aggregating offshore rig data to anyone who’s looking for it. We think this will benefit the industry, and that’s why Bassoe Analytics offers a free version.
Bassoe Analytics has also recently launched Bassoe Analytics Premium, a subscription service which gives users enhanced access to our offshore rig market data and analysis platform.
Premium provides subscribers with all the data needed to support tendering, contracting, business development, and investments.
Premium subscribers will also be able to download all data into MS Excel, allowing users to customize searches and use the data in reports to management, market presentations, and import into their own tools such as modelling or forecasting systems.
In addition, Premium subscribers will have full access to our mobile app (the only fully developed mobile rig app available in the market), providing the same valuable data that is available on the website.
Click here for more information on Bassoe Analytics premium.
Bassoe Offshore also provides custom market research and reports for users who would like more detailed regional- or sector-specific reports. If you are interested in a custom report, please contact us.
You can log in or sign up for access to Bassoe Analytics here: https://www.bassoe.no/analytics/ And make sure to download our mobile app here.
If you’re interested in upgrading to Bassoe Analytics Premium, you can send a request to us from our product description page.
Once you’re logged in, you can edit your profile by clicking on your name in the top right corner of the screen. Once you’re on your profile page, click on the Wrong or missing data? link to make edits to your profile.
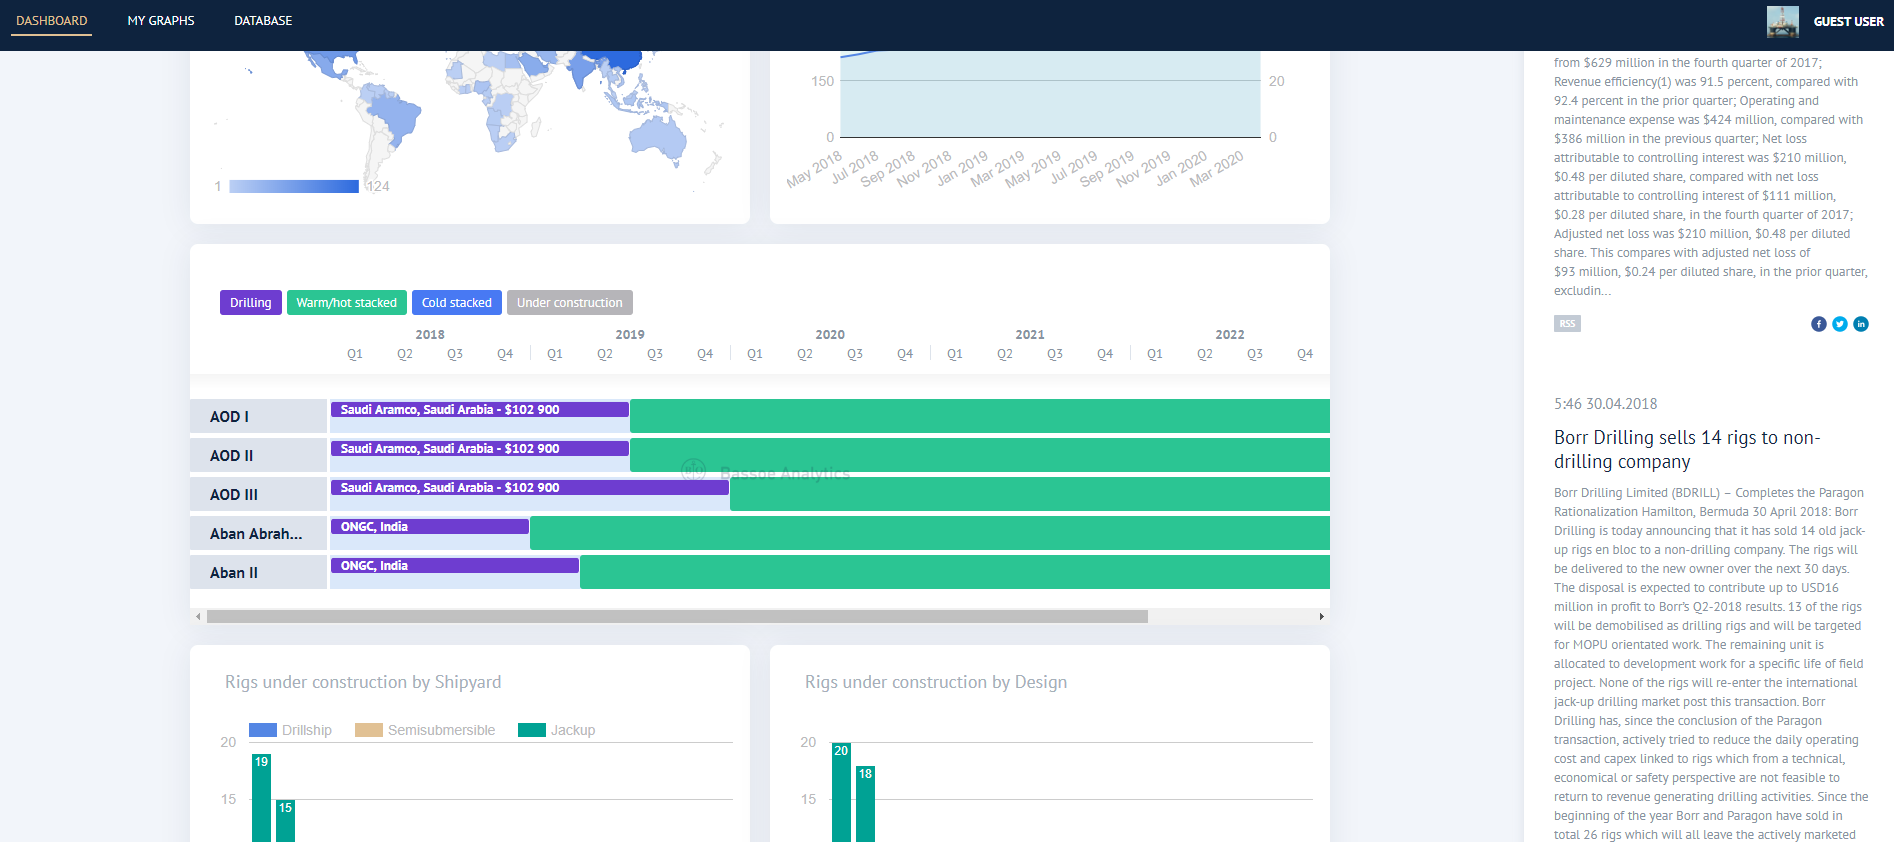
From your dashboard, you’ll be able to see summary information from the database, access each graph and data table, and read latest news. To access the graphs and database, you can either click on the Database link at the top of the page or click on any of the graphs (note: data tables are only accessible to Bassoe Analytics Premium subscribers).
Most of the data tables connected to each graph are the same, but Latest Fixtures shows all active contracts in the system, and Rig Sales by Type and Latest Rig Sales are connected to the Transaction Database.
If you want to manipulate any of the graphs, click on the appropriate graph and filter the data.

You can add and remove columns, change column width, freeze columns, and filter and sort columns in all of the data tables. If you are using a data table connected to a graph, the graph will update automatically as you filter and sort the data.
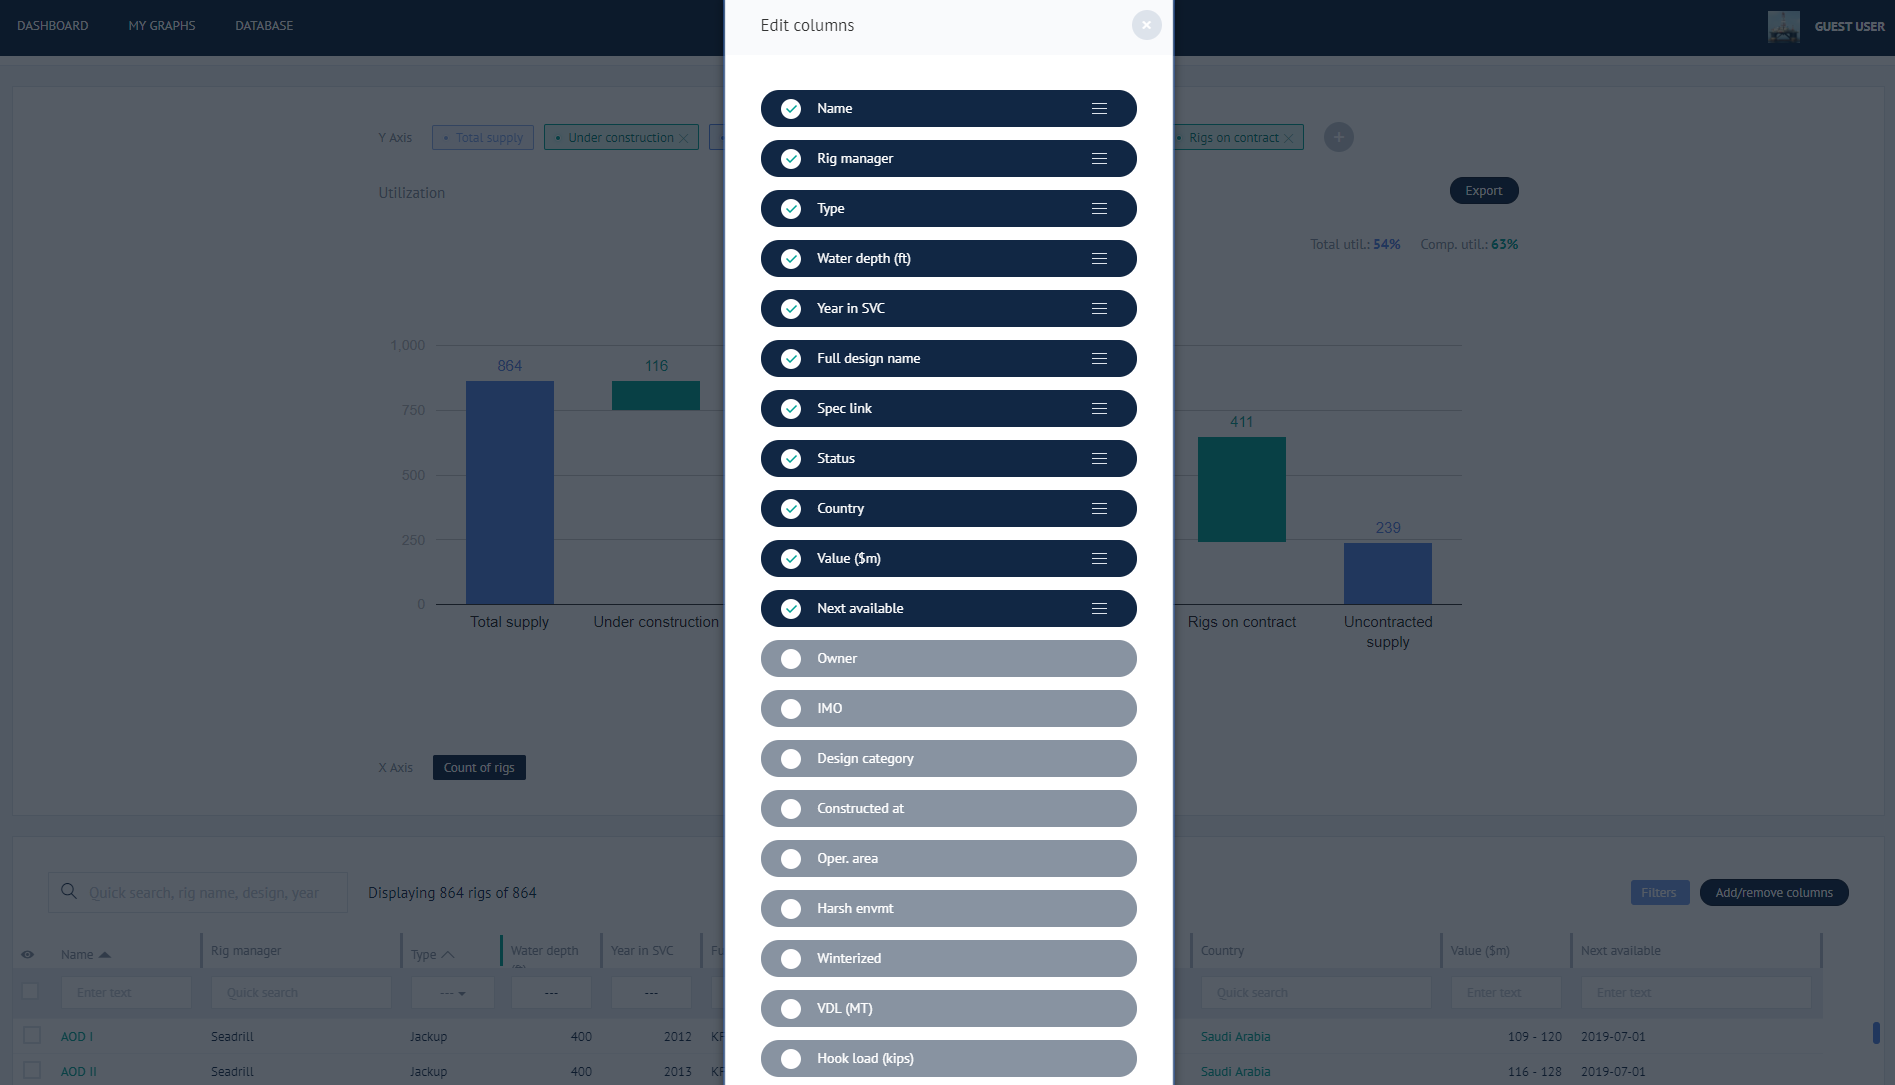
Add/remove columns by clicking on the Add/Remove column link above the data table:

In the popup window, you can select/deselect columns by clicking on them. And if you click and hold on the three lines next to each column name, you can drag the columns up or down to change their order in the data table.
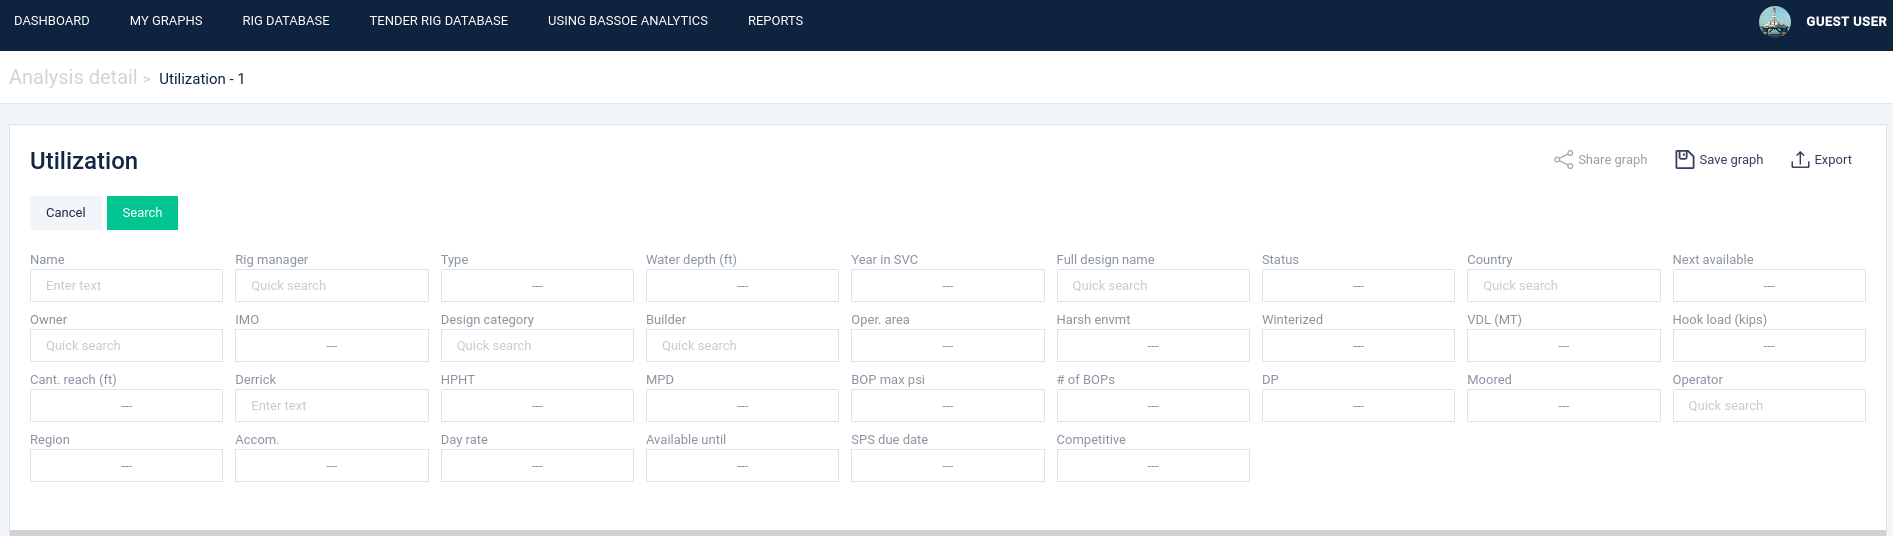
Search and filter columns by clicking on the View filters button at the top of the graph.

Choose desired filters and click Search to apply filters to graph (Free and Premium) and data table (Premium only).
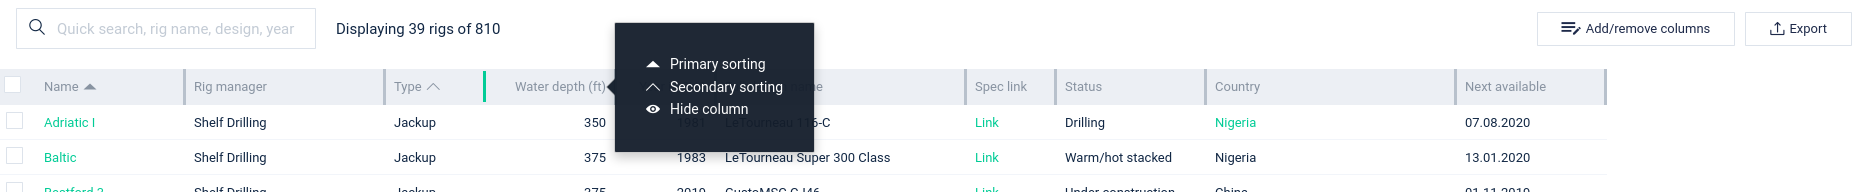
Columns can be sorted or hidden by clicking on each column name.
Columns can be frozen (for horizontal scrolling) by double clicking the grey separator link between each column. It will then become green, indicating the column where the pane is frozen.

Once you select columns, arrange your columns, and filter your data, you might want to have these selections available for future use (so you don’t have to set your preferences up again). To do this, click on the Save Graph button under your username at the top right of the screen. This will save the graph and the data table set up. Note that you can clear all filters by clicking on the Filters button next to the Add/Remove columns button. Filters can also be cleared individually from each column filter field.
When you click on „Save Graph“ you will be prompted to give a name for the Analysis so it can be stored in the My Graphs link at the top of the page. Here, we’ve filtered for floating rigs (semisubmersibles and drillships) built between 2000–2014 and which are currently in South America.
First, we set up columns and choose filters. Note that the data table is only available to Premium users.

Then we click on the Save Graph link and name the analysis.
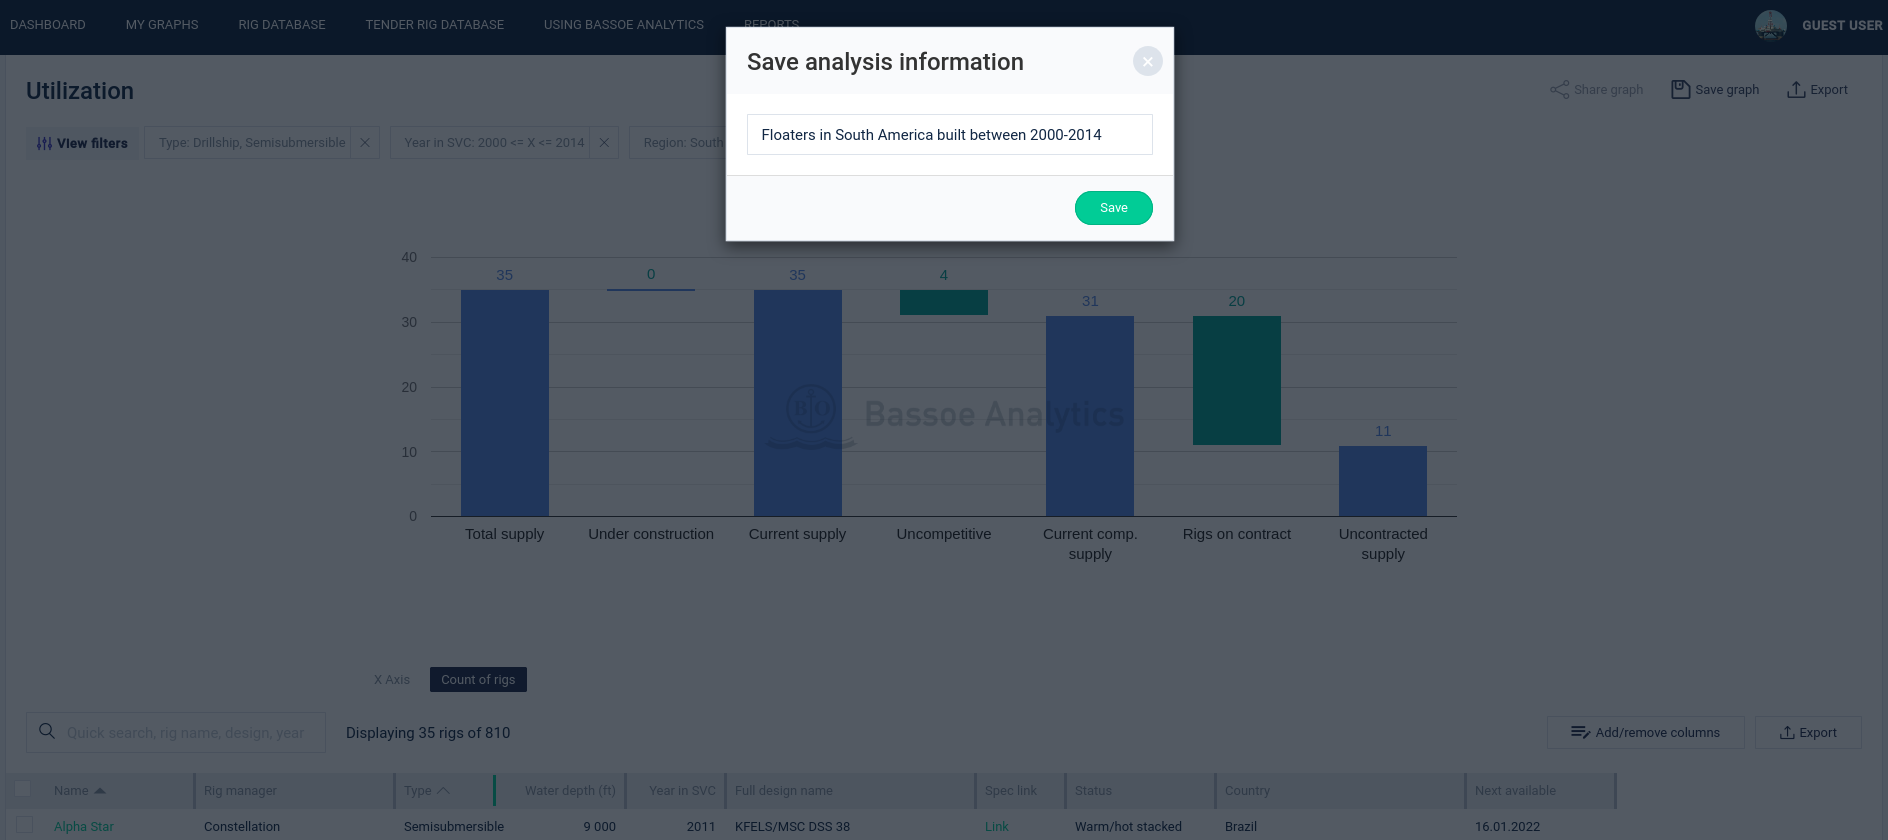
Once it’s saved, you’ll be able to access this analysis in My Graphs.

You can export any of the graphs as images by clicking on the Export link at the top right of the graph.

Then you can edit the name of the graph and click the Export button to save it as an image.

The graph will then be exported as an image file.
Bassoe Analtyics Premium subscribers can download all data from our data tables to Excel. This includes the main rig database, fixtures database, and transaction database. To export data, just click on the Export link above the data table.
Remember to add or remove your desired columns first and filter the data using the View filters button if necessary.

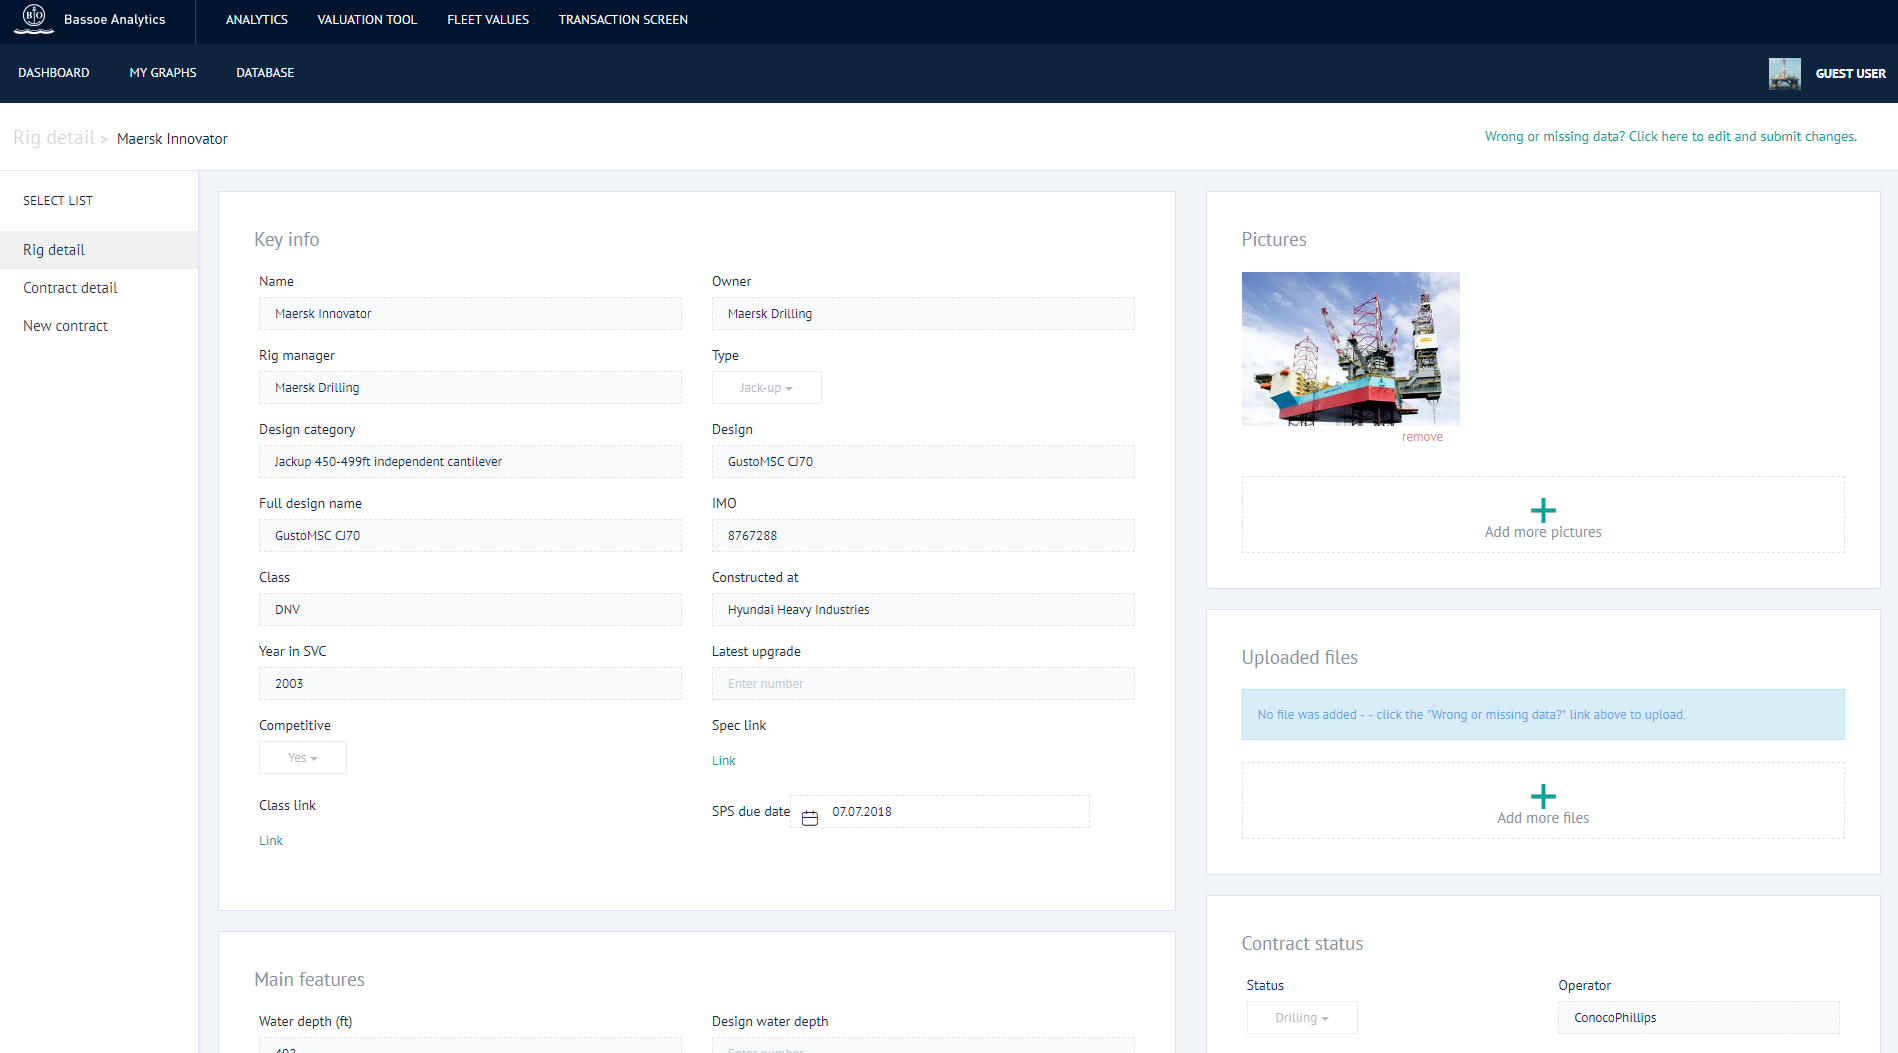
You can access the specifications for any rig by clicking on the rig name from any of the data tables (and then clicking on the Rig Details button) or by using the quick search box at the top of the dashboard.
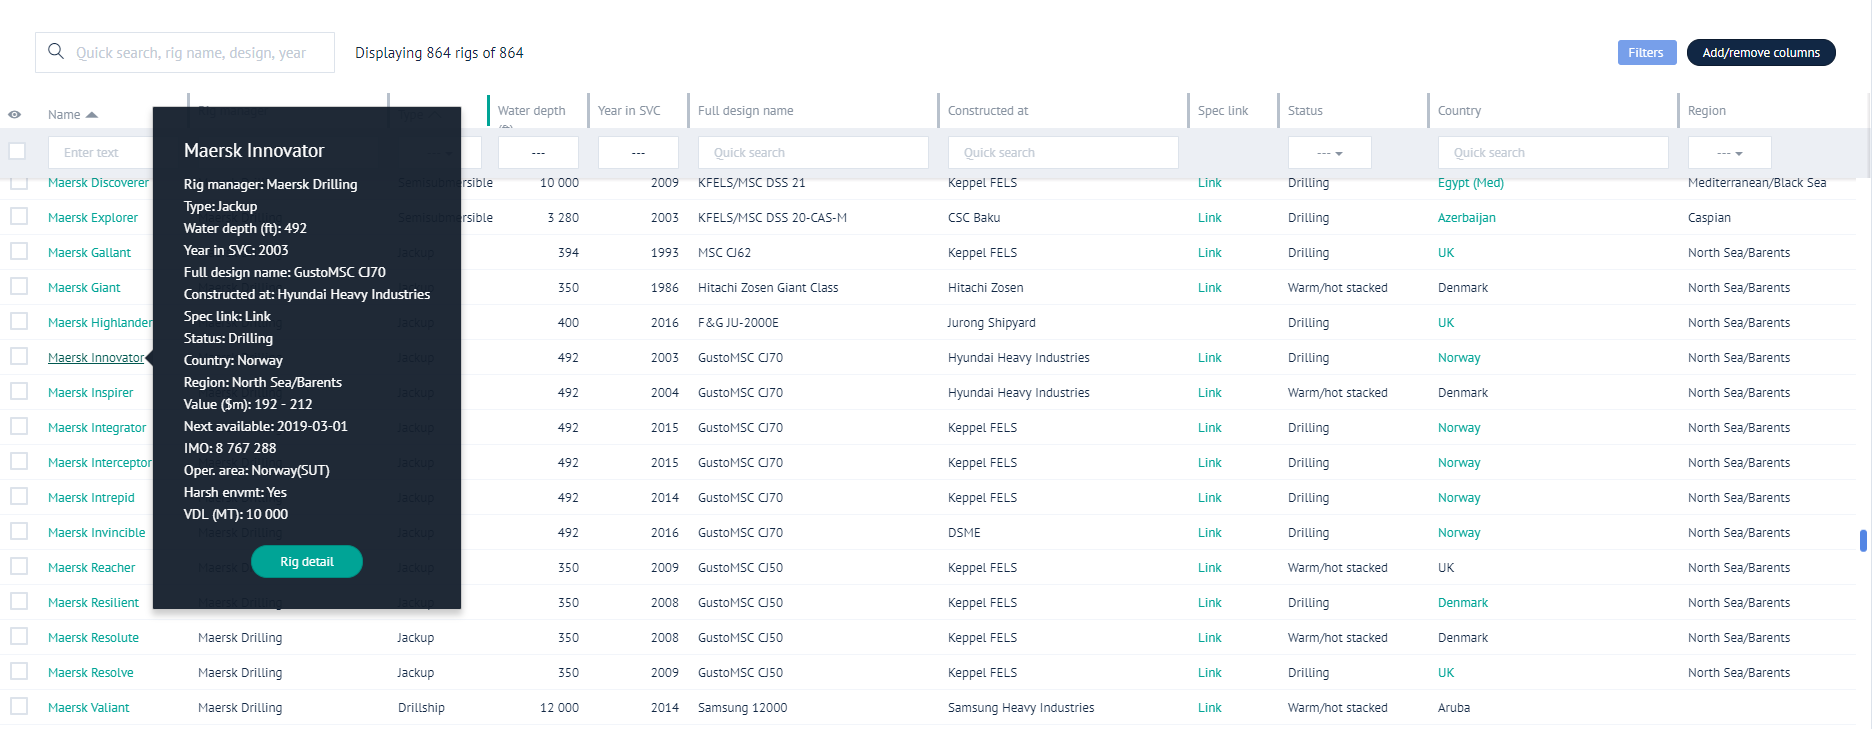
Once you’re on the rig details page, you’ll find additional data along with images and files (if they’ve been uploaded).

You can also click on the Contract detail link on the left side of the screen to view contract details for a rig.
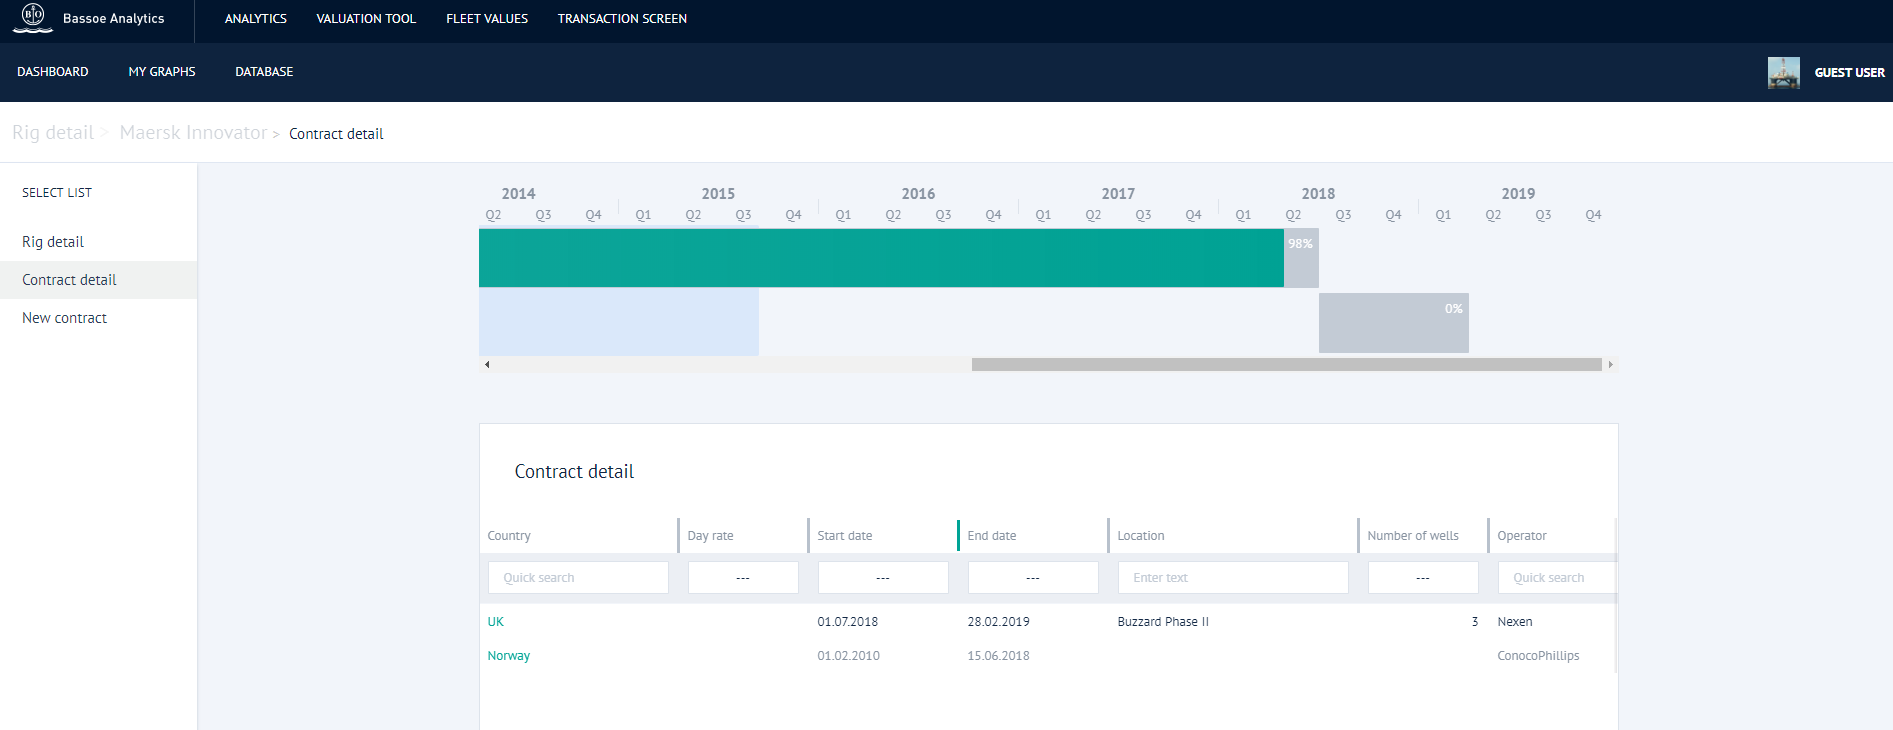
If you see contract details that you think need to be updated, you can edit data in current contracts by going into the contract details for the relevant contract. To do this, click on the Country name for that contract.
Here, we’ve clicked on the contract in Norway and are on the contract details page for that contract.
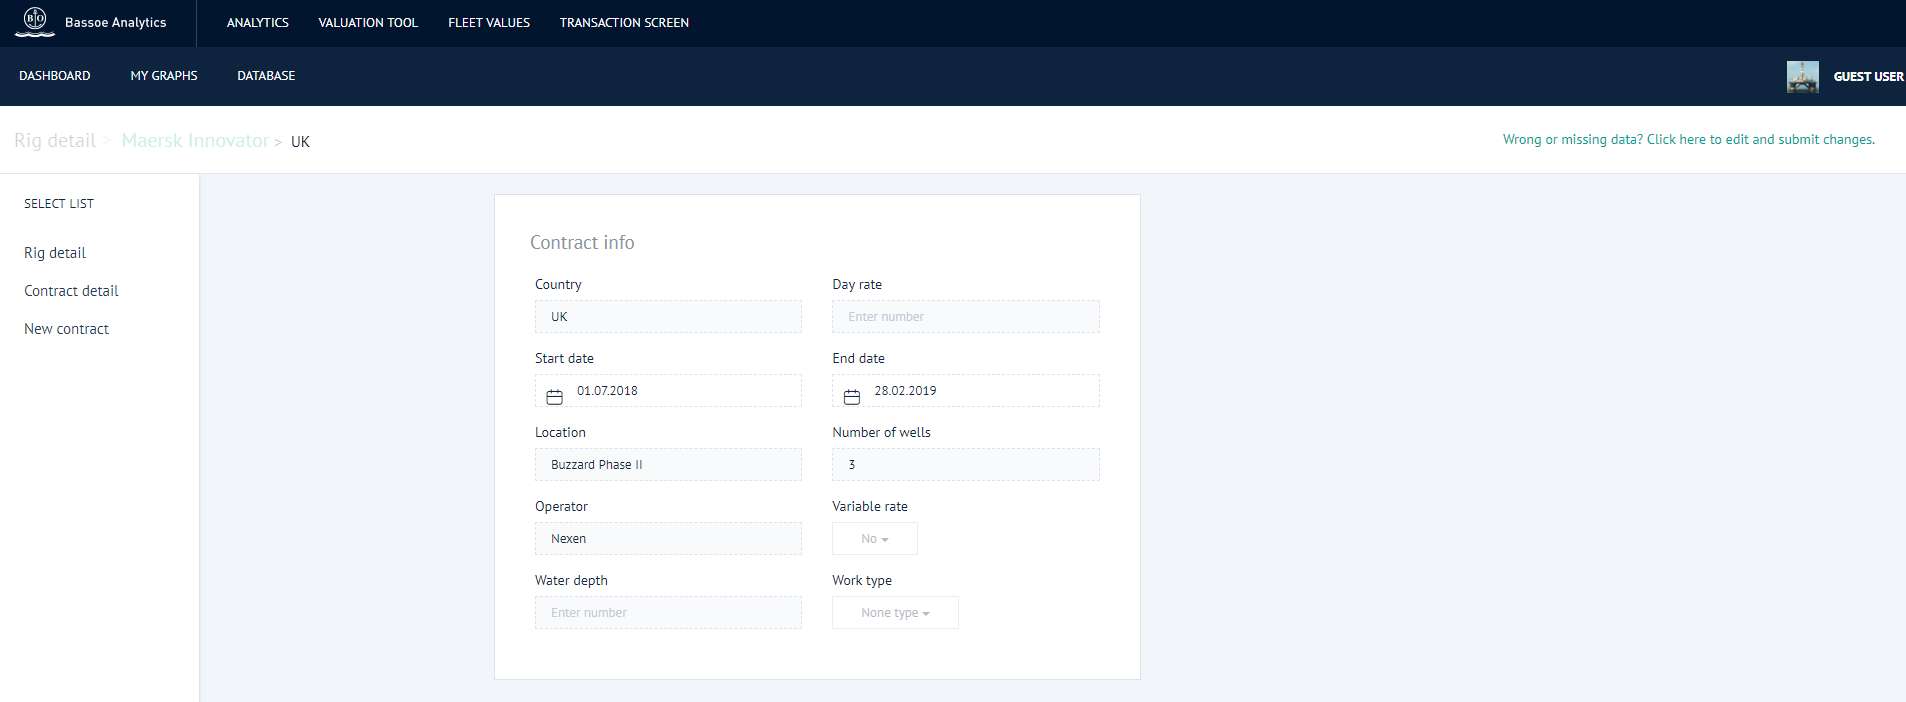
You can edit this data by clicking on the Wrong or missing data? link at the top right of the page. Here, we are changing the start date of the contract.
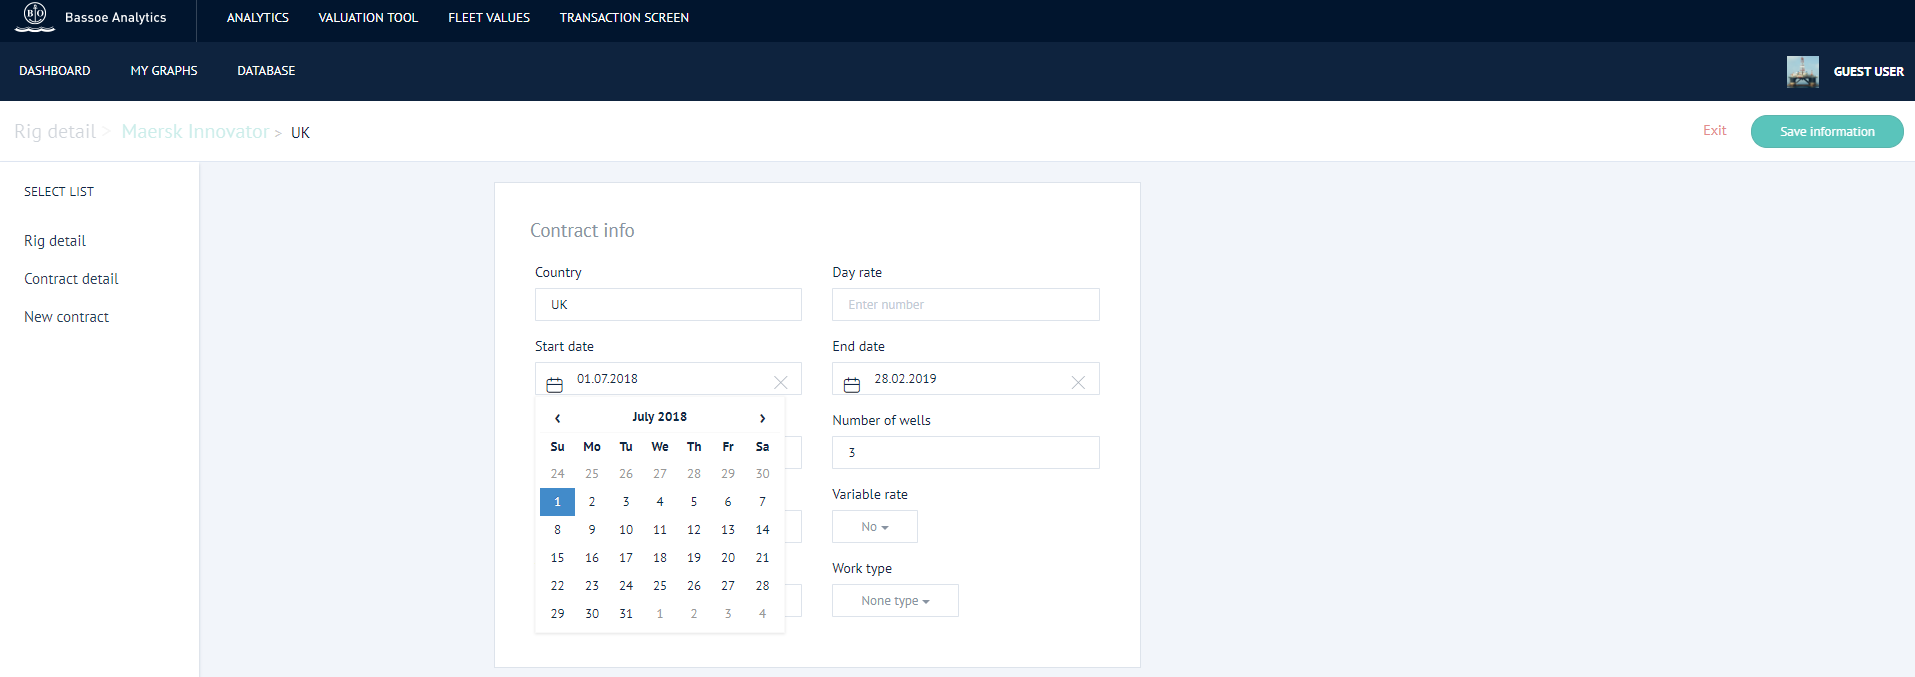
Once you’ve made an edit, click the Save information button. Bassoe Analytics will then review your edits and either approve or reject them.
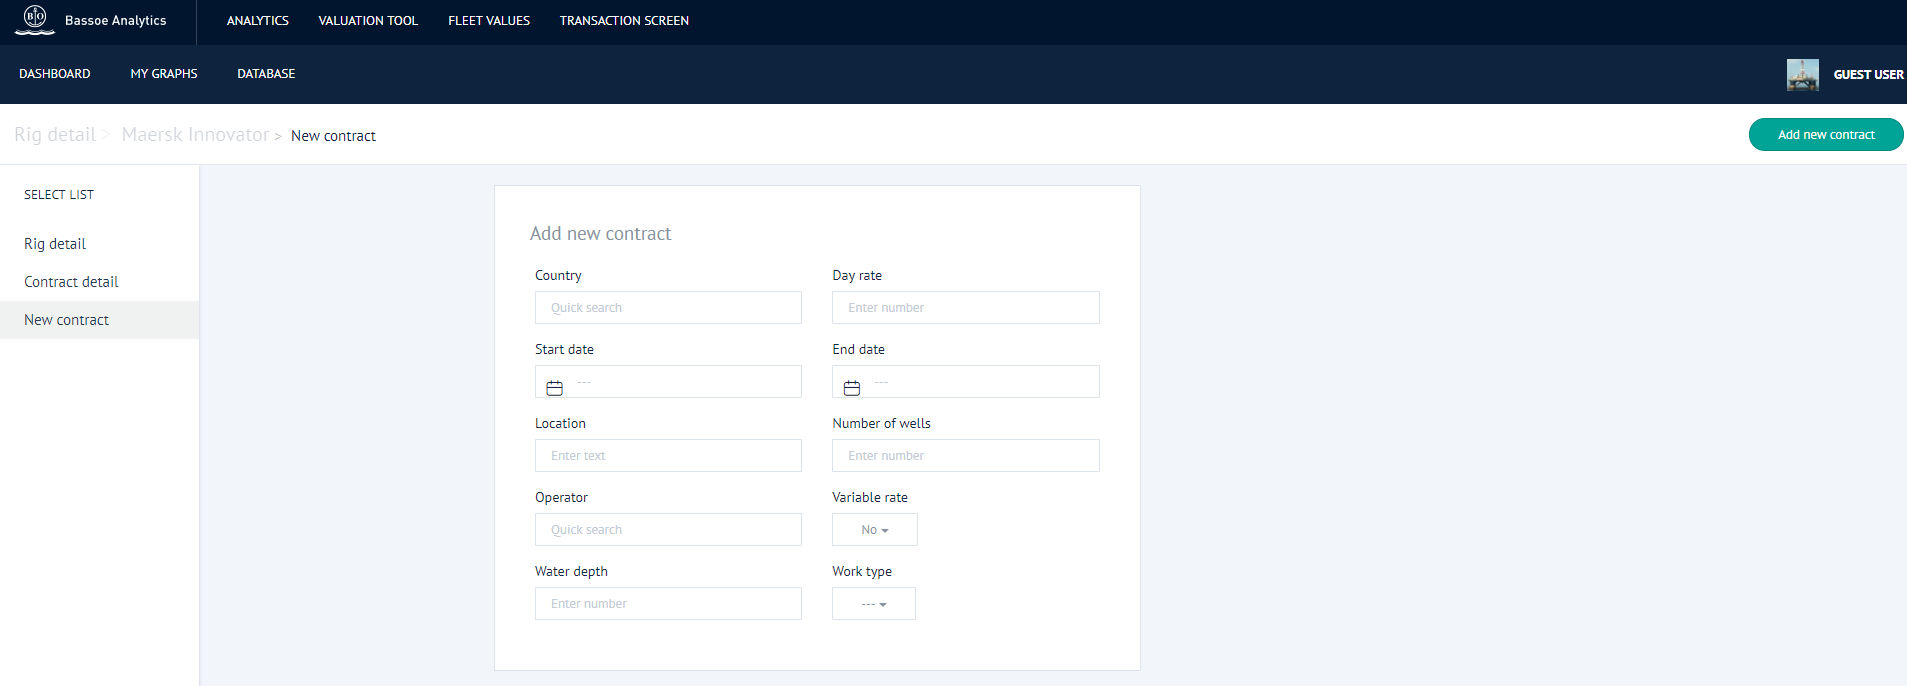
If you would like to add a new contract for a rig which doesn’t already exist in the system, click on the New contract link on the left side of the page. Once you have entered the details, click on the Add new contract button at the top right of the page. Bassoe Analytics will then review the new contract information and either approve or reject it.
From the rig details page, you can edit rig specifications, add images, and add files. Just click on the Wrong or missing data? link at the top right of the page to enter edit mode.
Once you’ve clicked on the Wrong or missing data? link, you can edit the relevant fields. You can also upload images and files by clicking the Add more pictures or Add more images links on the right side of the page.
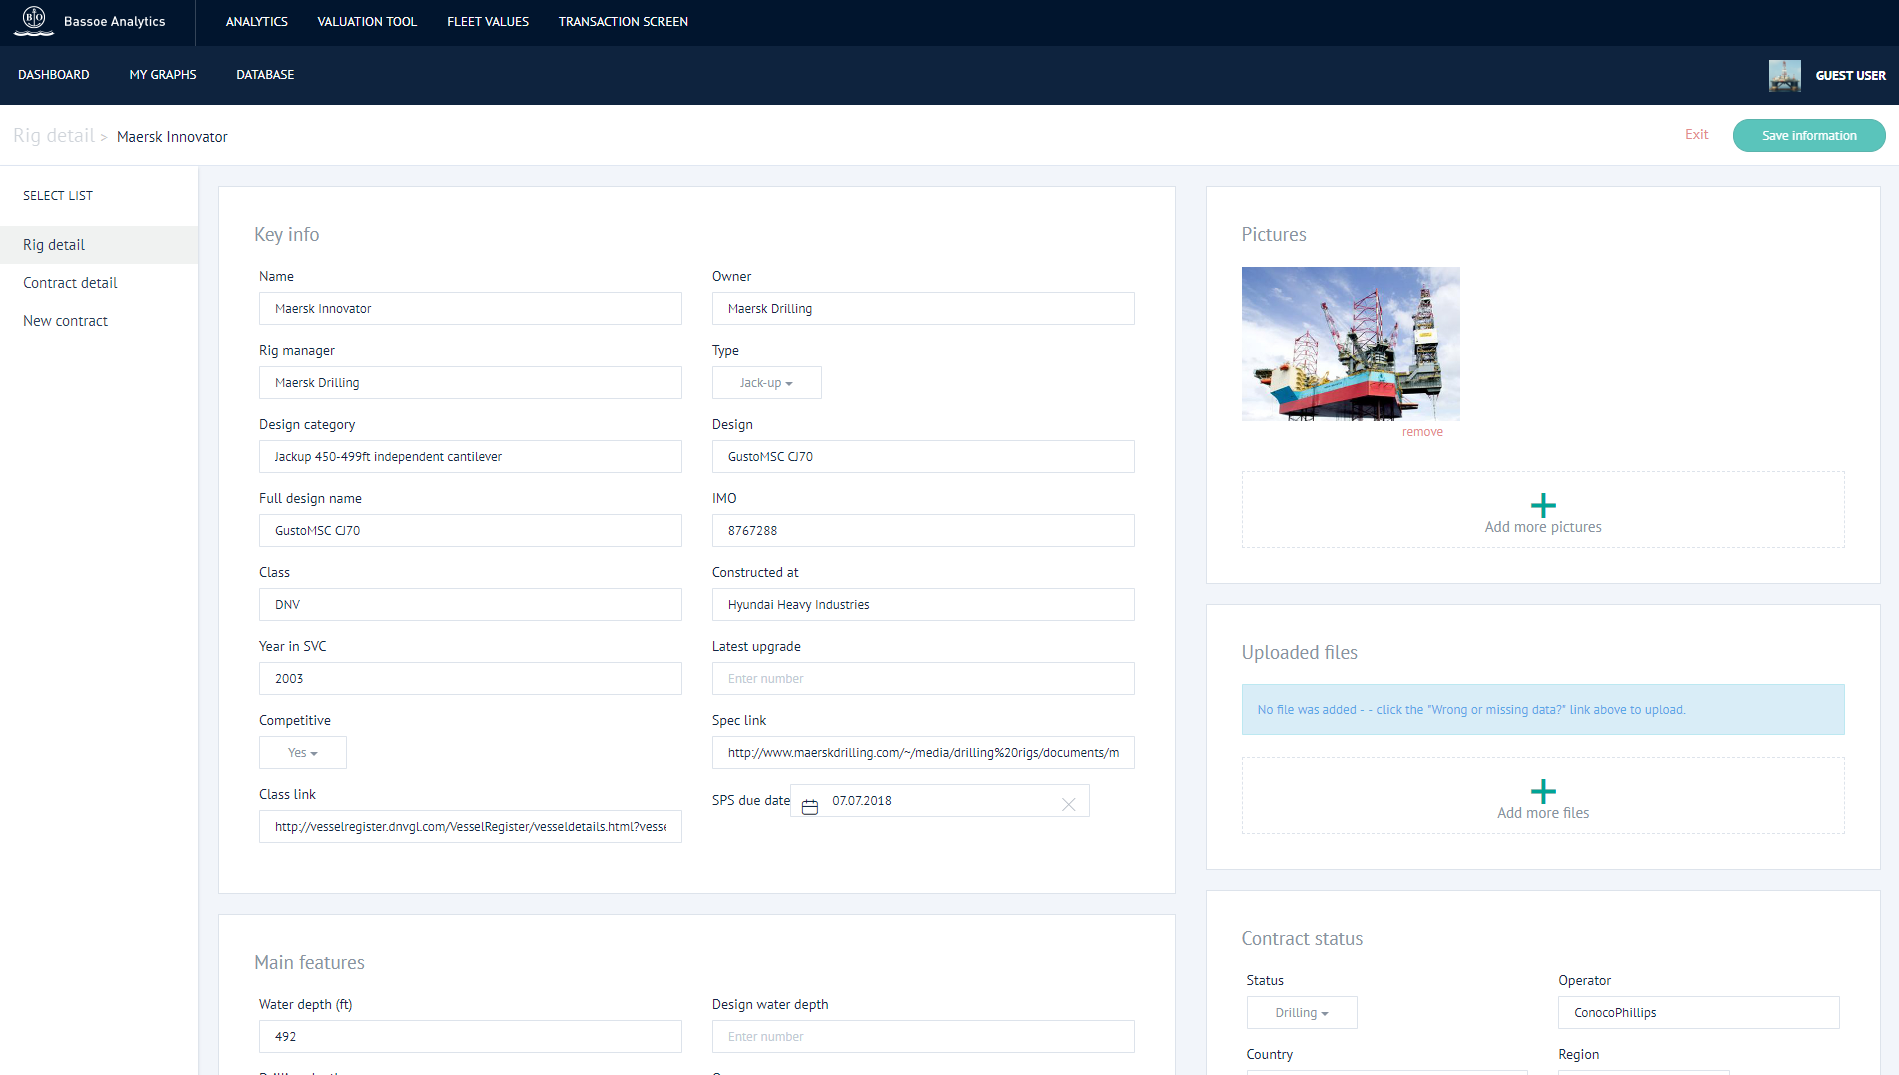
Once you’ve finished editing, click on the Save information button at the top right of the page. Bassoe Analytics will then review the data updates and either approve or reject them.
To see contract status for multiple rigs, click on the timeline chart on the dashboard.
Inside this page, you can sort the data table to show the rigs you are interested in. In this case, we’ve filtered for jackups with SUT (Norway-compliant) by filtering the Operating Area column for Norway(SUT). If your list is long, click on the Expand Graph button at the bottom of the timeline to expand the area of the contract overview timeline.
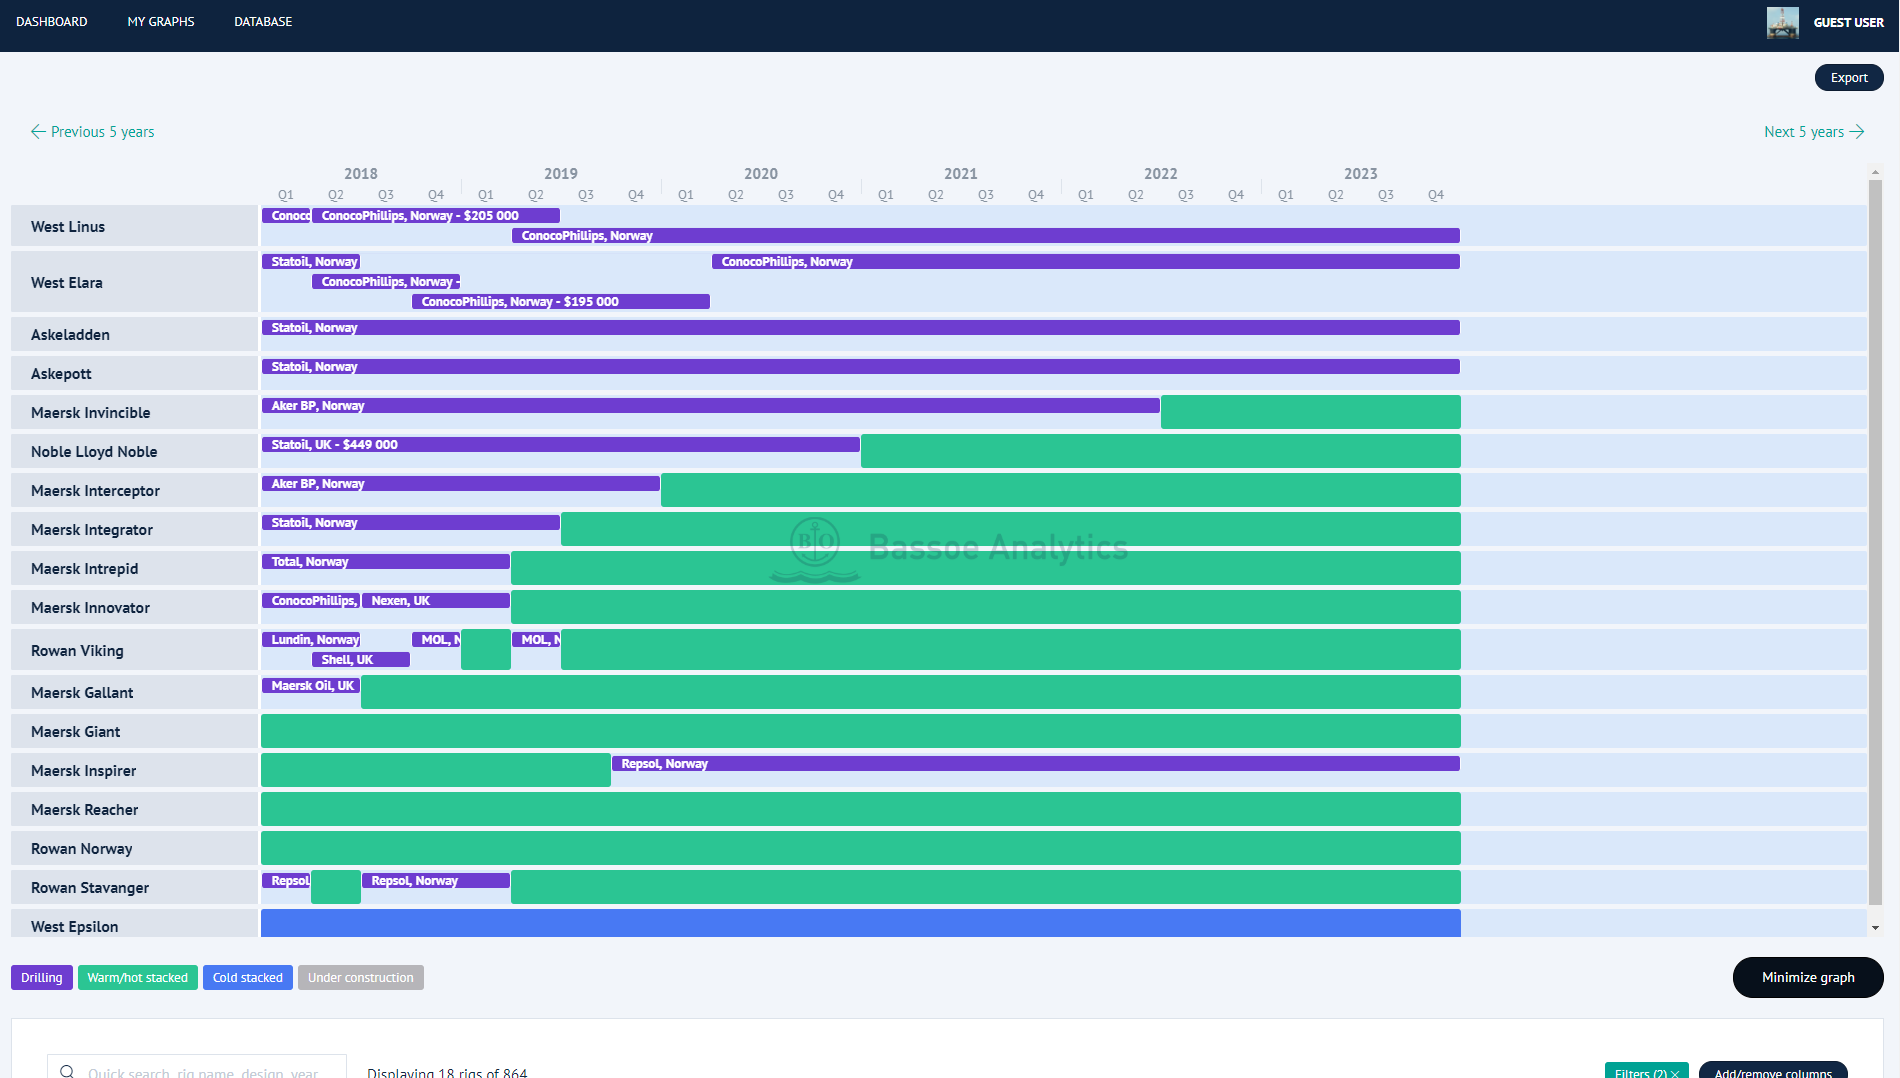
The contract overview can also be exported as an image just like any of the other graphs. When exporting the contract overview, all rigs filtered for will be exported (this may be more than you see inside the timeline area).
Offshore drilling rig values are provided by our Rig Valuation Tool (RVT). The RVT is an application which provides updated values for drilling rigs.
The RVT gives rig owners, investors, shipyards, financial institutions, and others with interest in the offshore oil and gas industry access to asset valuation data which goes beyond the scope of traditional rig valuation tables.
With the RVT, you can click through the steps to find value ranges for rigs by design and age range.
To access the RVT, click on the Rig Values link in the top header on the Bassoe Analytics dashboard.
Click here for more information on the RVT.

Bassoe Analytics uses five rig status definitions: Drilling; Warm/hot stacked; Cold stacked; Undergoing repair/SPS; and Under construction. Although status is sometimes subjective, Bassoe Analytics’ status definitions simplify this for practical reasons.
Status is defined as follows:
Drilling – the rig has an active drilling contract (the contract has started).
Warm/hot stacked – the rig is ready or substantially ready to return to drilling operations.
Cold stacked – the rig is in a state which requires reactivation before returning to drilling operations (includes rigs which are “smart stacked” or in some state of preservation). Note that cold stacked rigs can still be marked as competitive in the database if they are actively being marketed.
Undergoing repair/SPS – the rig is undergoing significant reactivation, modification, or class survey activities.
Under construction – the rig is not yet delivered from the shipyard to the owner (this includes rigs which may be complete and ready for delivery, but have not been formally delivered or are stranded and controlled by the shipyard).
This guide gives an overview of Bassoe Analytics’ basic features, but there’s a lot more you can do with the platform. If you have any questions which aren’t covered here, please let us know.
You can also check out our short video here.
Get email updates for our latest offshore rig market commentary.
© 2026 Bassoe Offshore. Design og utvikling av ![]() Responsiv Media Privacy Policy
Responsiv Media Privacy Policy